※ Documentation:
This website is free and open to all users and there is no login requirement.Tutorial:
Results intepretation:
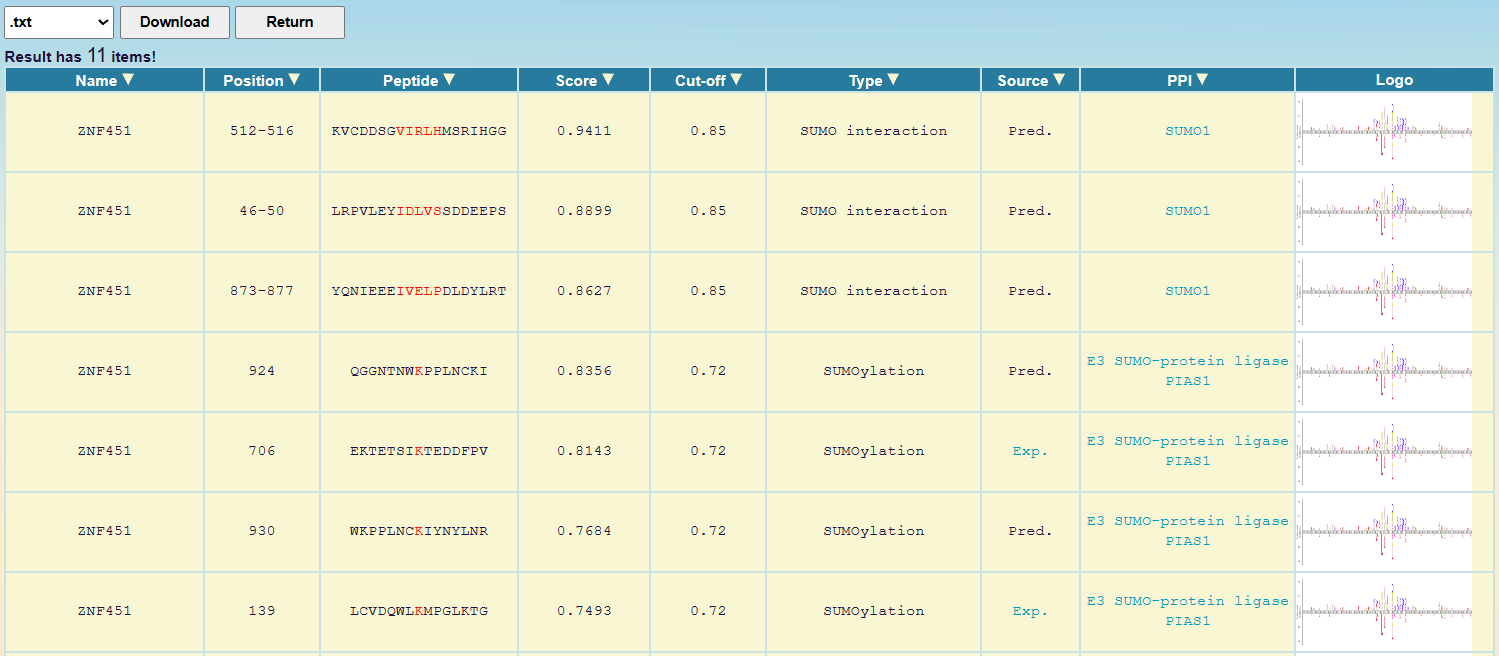
Here we use the human protein ZNF451 as the example. After clicking "Submit", the prediction results of SUMOylation sites and SIMs with high threshold are shown as follows:
<1>. The table of the GPS-SUMO 2.0 results

ID:The name/id of the protein sequence that you input to predict.
Position: The position of the site which is predicted to be sumoylated or to interact with sumo protein.
Peptide: The predicted peptide with 7 amino acids upstream and 7 amino acids downstream around the modified residue.
Score: The value calculated by GPS-SUMO algorithm to evaluate the potential of SUMOylation or sumo interaction. The higher the value, the more potential the residue is sumoylated or interact with sumo protein.
Cut-off: The cutoff value under the threshold. Different threshold means different precision, sensitivity and specificity.
Type: Whether the sequence is SUMOylation site or sumo interacting motif.
Source: Whether the result is validated by experiment, "Exp." means YES, while "Pred." means NO. "Exp." links to the CPLM 4.0 source site.
PPI: The protein interacting with the substrate in predicted sumo events. For SUMO sites, we provide Protein-Protein Interaction (PPI) information for the target protein and E3 enzymes. If it's a SIM, we offer the PPI information for the target protein and SUMO proteins.
Logo: The sequence logo of this peptide.
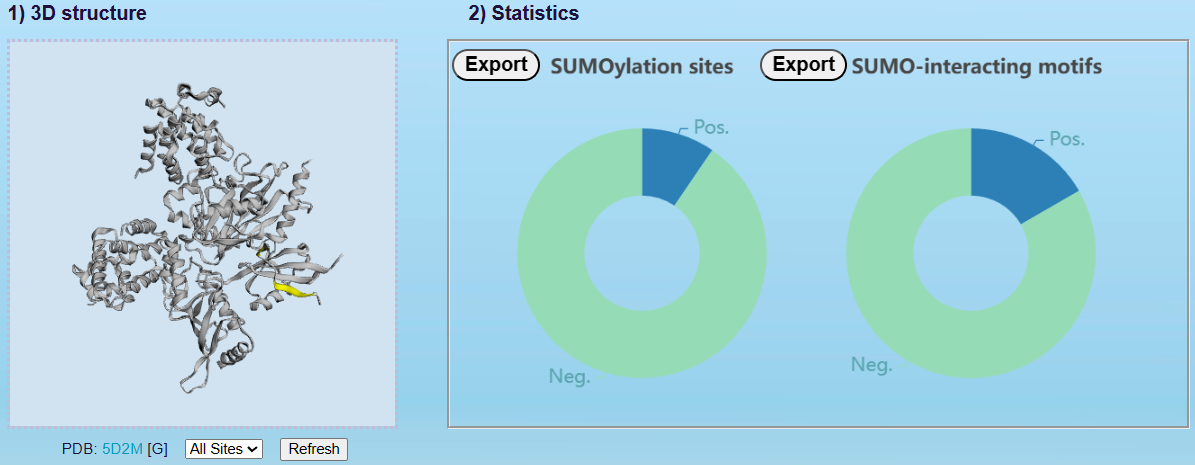
<2>. The visualization of default prediction
Part 1:
Left: The 3D structure of the substrate labeled with predicted sites.
Right: The distribution of negative sites and positive sites in SUMOylation sites.
The distribution of negative sites and positive sites in SUMO-interacting motif.
You can click on the “Export” button to download statistical graphics.

Part 2:
Up: The visualization for the positional distribution of the predicted site in protein sequence. By default, the sites with the highest 3 predicted scores are displayed.
Down: The visualization for protein disordered region predicted by IUPred
[PMID: 15955779]. Cutoff = 0.5, if score of prediction > cutoff, the residue is considered in disordered region.
You can minimize the chart by clicking the 'Min' button, maximize it by clicking 'Max,' or use the slider button to adjust the scale of the peptide sequence length to the desired size for convenient observation.


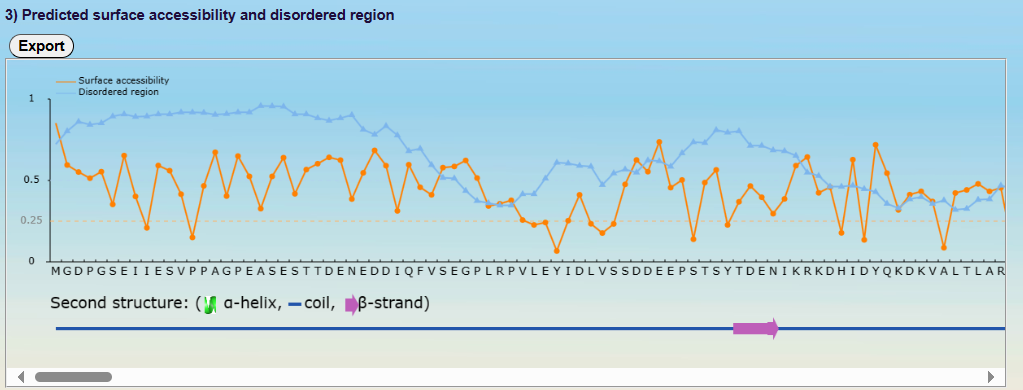
<3>. The visualization of comprehensive prediction
Part 3:
Top: The surface accessibility of amino acids and the protein disordered region were predicted by
NetSurfP ver. 1.1 (PMID: 19646261) and IUPred
(PMID: 15955779), respectively. The cutoff of disordered region prediction = 0.5, if score of prediction > cutoff,
the residue is considered in disordered region. The cutoff of surface accessibility prediction = 0.25, if score of prediction > cutoff, the residue is considered as surface exposed residue.
Bottom: The positions of the predicted SUMOylation sites or SIMs were visualized in the protein sequence together with the secondary structure predicted by NetSurfP ver. 1.1 (PMID: 19646261).

Frequently Asked Questions:
1. Q: How to use GPS-SUMO 2.0 web server?
A:
Please visit GPS-SUMO 2.0 at HOME page(https://sumo.biocuckoo.cn/index.php). We provide the default service.
(1) GPS-SUMO 2.0 (PLR): Prediction based on penalized logistic regression with the group-based prediction system feature. We provide 3D structure, statistics and disorder propensity of protein.(Also available at the HOME page). ( For Windows and Unix/Linux users, please use the keyboard shortcuts "Ctrl+C & Ctrl+V" to copy and paste your FASTA format sequences into TEXT form for prediction. And for Mac users, please use the keyboard shortcuts "Command+C & Command+V". You could input one primary sequence or multiple proteins' sequences in FASTA format. Then please click on the "Submit" button to run the program. The prediction results will be shown in the prediction form. Again, please click on the ‘Download’ button on the top of the prediction form to save the results in TXT, Excel or ZIP format. If you want to download statistical graphics, please click on the “Export” button.
A:
Yes! Firstly, the fourth-generation GPS (Group-based Prediction System) algorithm was remained in GPS-SUMO 2.0 and more sequence- and structure- based features and deep learning algorithm have been added. The prediction performance was greatly improved against our previous tools. Secondly, we updated options allowing users to predict with protein sequence or identifiers. We also provide the PPI information, sequence Logo, 3D structures, links to PTM database and prediction of secondary structure and disorder propensity. The visualization and user-friendless were greatly improved. Thirdly, the training data set of GPS-SUMO 2.0 was updated by searching the scientific literature published before June 2020 and 13 PTM databases, which is the largest amount of training data so far. Thus, the prediction accuracy of GPS-SUMO 2.0 was significantly improved.
3.
Q: There are three thresholds used in your predictor, what do these parameters mean? A:
There are two types of predictors including SUMOylation sites or SUMO-interacting motifs, the threshold options only affect the corresponding one. After GPS-SUMO 2.0 predictor model was well-trained, we performed an evaluation on this model. From the evaluation, three thresholds with high, medium and low stringencies were chosen for GPS-SUMO. The performance under these three thresholds was presented as follow:
4. Q: I have a few questions which are
not listed above, how can I contact the authors of GPS-SUMO 2.0? A:
Please contact the responding author: Dr. Yu Xue
for details.
5. Q: Can I use GPS-SUMO 2.0 on different browser? A:
Yes, we test our web server on different browsers.
And for advanced prediction, We provide 6 versions of prediction for users at ADVANCED page(https://sumo.biocuckoo.cn/advanced.php). You can click the check box at ADVANCED page to change the online service mode or just click the following names of predictor:
![]() Speed:
Speed: ![]()
![]()
![]()
![]()
![]() )
)
(2) GPS-SUMO 2.0 (Transformer): Prediction based on Transformer with the contextual information, which balances the accuracy with speed. (![]() Speed:
Speed: ![]()
![]()
![]()
![]() )
)
(3) GPS-SUMO 2.0 (Comprehensive): Prediction based on all models with all features. (![]() Speed:
Speed: ![]()
![]()
![]() )
)
(4) GPS-SUMO 2.0 (Species-specific):Species-specific prediction based on all models with all features. We provide 13 species for species-specific prediction. If you want to focus on certain species, you may choose this one. (![]() Speed:
Speed: ![]()
![]() )
)
(5) GPS-SUMO 2.0 (Comprehensive): Prediction based on all models with all features and additional annotations of secondary structure and surface accessibility. (![]() Speed:
Speed: ![]() )
)
(6) GPS-SUMO 2.0 (Stress conditions): Prediction based on penalized logistic regression, using 39,938 non-redundant SUMOylation sites identified under various stress conditions, such as SUMO protease inhibition, proteasome inhibition and heat shock. (![]() Speed:
Speed: ![]()
![]()
![]()
![]()
![]() )
)
In each of the above 6 prediction versions, you can choose sequence(s) in FASTA format or UniProt accession number(s) for prediction by clicking the corresponding check box.
2.
Q: Is GPS-SUMO 2.0 much better than GPS-SUMO?
Content GPS-SUMO 2.0 GPS-SUMO SUMOsp 2.0 SUMOsp Non-redundant Data Sets SUMOylation Sites 59,069 912 332 239 SUMO Substrates 10,762 510 197 144 SIMs 163 137 0 0 SUMO-interacting Proteins 102 80 0 0 Species 13 12 9 6 Data Size ~7.2 GB ~30 MB ~17 MB ~10 MB Algorithms and Functions Features 11 1 1 1 SIM Predictor √ √ × × Species-specific Prediction √ × × × PPI Pairs 27,482 × × × 3D Structures 6,428 × × ×
SUMOylation
SUMO interaction
Ac
Sn
Sp
MCC
Pr
Ac
Sn
Sp
MCC
Pr
High
88.63%
57.45%
95.17%
0.5749
71.39%
94.64%
90.06%
95.17%
0.7551
68.08%
Medium
86.60%
68.24%
90.46%
0.5585
60.00%
90.88%
98.14%
90.05%
0.6823
53.02%
Low
84.33%
75.98%
85.01%
0.5293
51.54%
86.80%
99.38%
85.36%
0.6081
43.72%
OS Version Chrome Firefox Microsoft Edge Safari Linux Ubuntu 18.04 107.0.5304.107 107.0.1 N/A N/A MacOS HighSierra 107.0.5304.107 107.0.1 N/A 13.1.2 Windows 10 107.0.5304.107 107.0.1 108.0.1462.46 N/A


